Tunnel Vision
Tunnel Vision turns any MTA subway map into an interactive exploration of NYC through data.
Embed Watch on YouTube Watch on Vimeo
MTA Data
Discover where people are entering, where people are exiting and how many people are in the subway at a given time. Tunnel Vision uses turnstile and schedule data from the MTA.
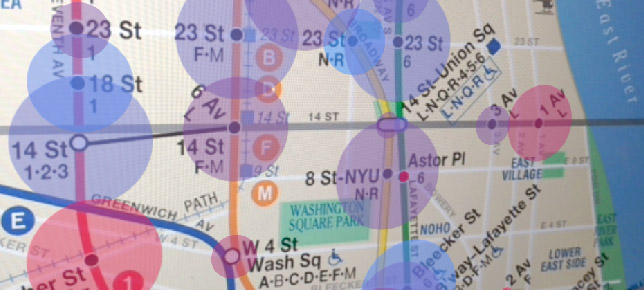
US Census Data
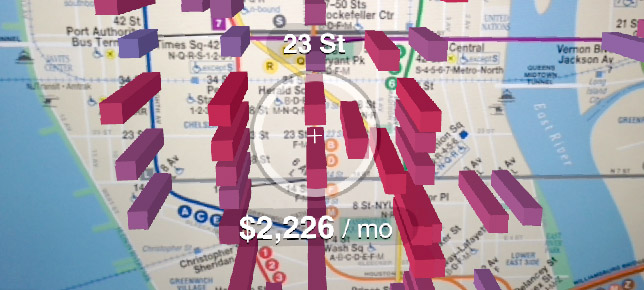
What are the median incomes in each neighborhood? How much are people paying for rent throughout New York? Explore US Census data to answer these questions and more.
About
The image of the MTA subway map is distinctive and ubiquitous throughout New York. Tunnel Vision uses the map as a platform to explore the city through data-visualization. The app pulls data from a variety of sources and seamlessly integrates them into the map by drawing over the camera feed.
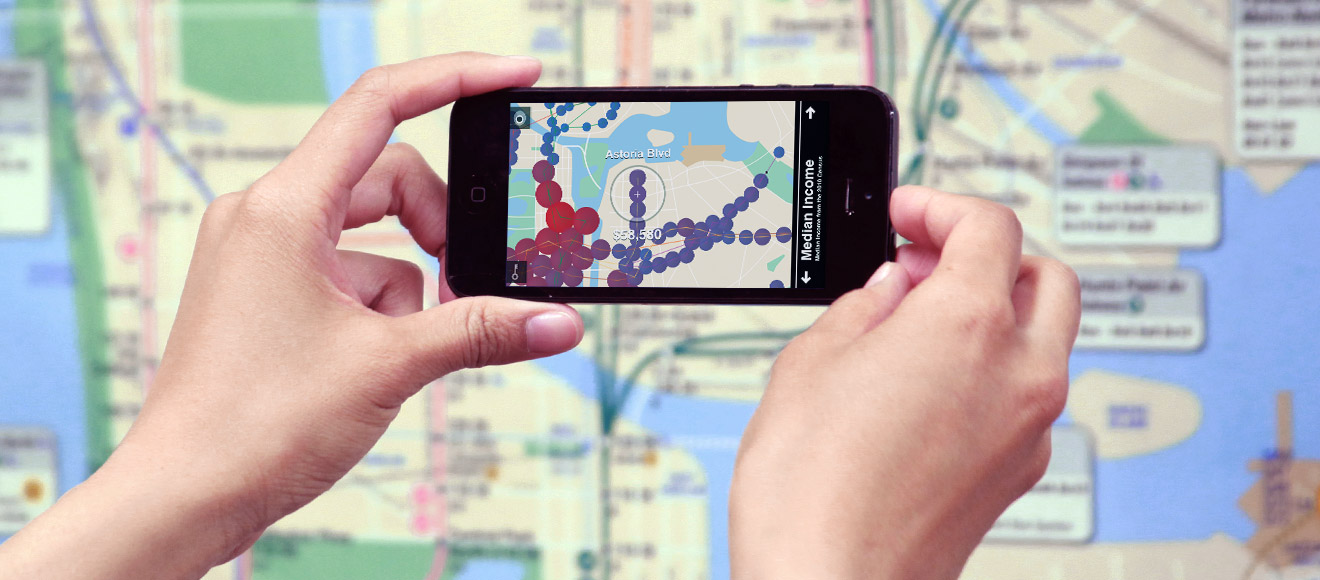
When a rider is waiting for the subway, she points her phone at the map to activate Tunnel Vision. The map comes to life with animations that add context to the ridership experience. By simply moving the phone around the map, she can explore many kinds of data including turnstile activity, rent prices, income, etc..
Contact

Tunnel Vision was written by Bill Lindmeier as a thesis project at ITP / NYU.
I specialize in mobile applications, creative coding, application prototyping and data visualization.
Selected Portfolio: wdlindmeier.com
Email: bill@wdlindmeier.com
Twitter: @wdlindmeier
Brooklyn, NY